georgeclerk/iStock via Getty Images
Regency Centers (NASDAQ:REG) is a large cap shopping center REIT. It has long been a strong operator but has also consistently traded at a premium to the sector, which has largely kept us uninterested in the name. However, a bumper 2nd quarter report caught our attention so we are adding REG to our coverage.
Shopping centers, as a sector, have had multiple strong quarters in a row on the leasing front. New leases are consistently being signed well above expiring rent, but it hasn’t really translated to particularly strong same-store NOI growth or FFO/share growth. The sector has largely remained discounted because investors want to see the leasing prove out into real growth.
Regency’s quarter was notable because it did exactly that.
- 7.4% same-store NOI growth
- 9.4% FFO/share growth
Let us begin with an overview of Regency Centers and then dig into the reasons why their leasing is better translating into growth.
Regency Centers Overview
REG owns over 57 million square feet of retail space located across the USA.
S&P Global Market Intelligence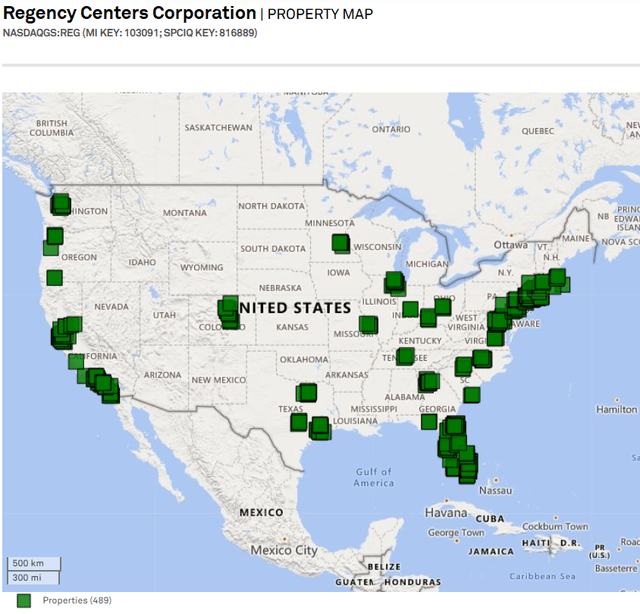
Their property locations essentially mirror population density distribution which makes REG a great bellwether for national shopping center performance.
Property level performance has been strong and trending upward. Occupancy has eclipsed 96% which is essentially full because there is always going to be some frictional vacancy.
2MC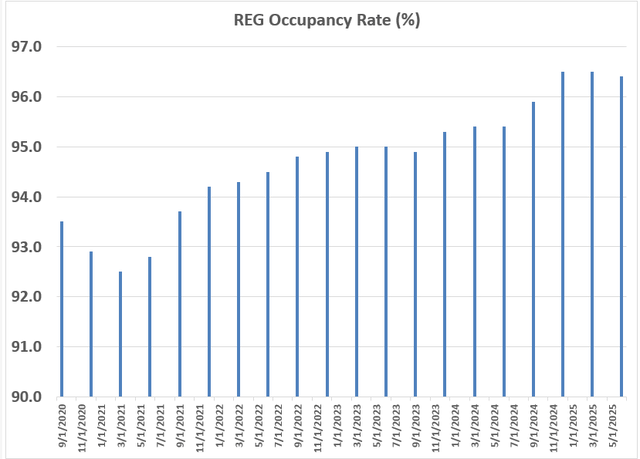
The company has pushed rental rates up as occupancy rose leading to increasing same-store NOI growth.
S&P Global Market Intelligence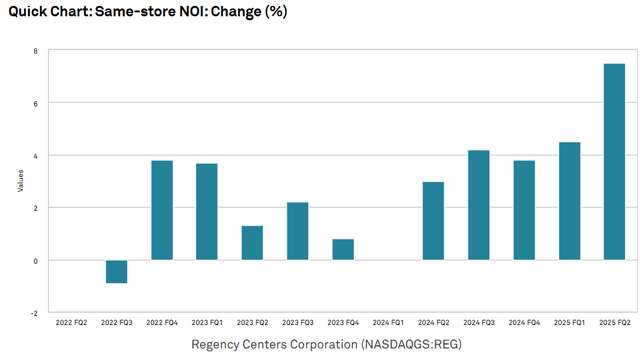
AFFO/share has been growing nicely and is projected to continue rising at a good pace.
S&P Global Market Intelligence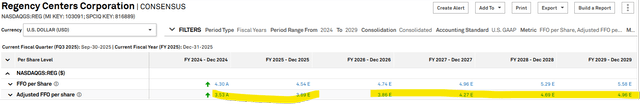
$3.53 to $4.96 in 5 years represents an 8% average pace (not compounded).
Despite the growth, its stock price has done a whole lot of nothing, up a mere 15% over 10 years.
SA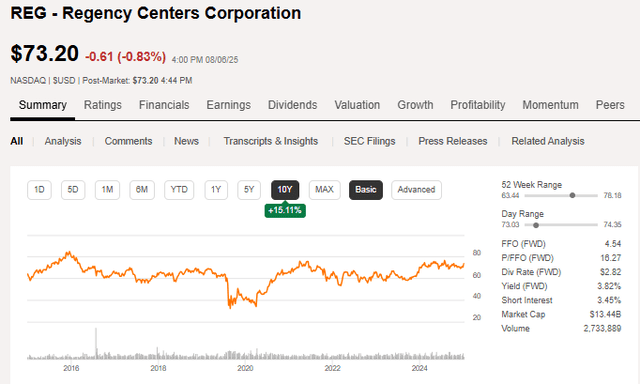
That contrast between fundamentals and stock price has made REG quite a bit cheaper than it used to be.
Valuation
REG is trading at 18.9X forward AFFO and 95% of net asset value. Given its reasonably low leverage, size and operating history I think it is undervalued. In my opinion 20X-22X would be more appropriate for its growth rate.
However, similar undervaluation is plaguing the entire sector so REG’s value is less clear on a relative basis. Even when using a leverage neutral adjustment, REG is trading at a significant premium to peers.
Portfolio Income Solutions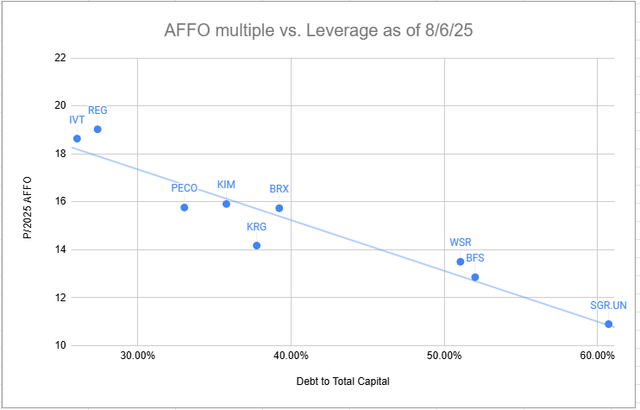
Some premium is warranted by REG’s operational excellence, but I still prefer certain peers.
One potential reason REG trades at a premium is that its leasing seems to be better translating into other growth measures like Same-Store NOI and AFFO/share. With that in mind, I would like to dig into the mechanics of how leasing flows through to the bottom line.
Leasing success translating into real growth
Regency reported 19.3% GAAP leasing spreads and 10% cash leasing spreads. Per usual, new leases were a bit high at 27.7% GAAP and renewals were a bit lower at 17.2% GAAP.
REG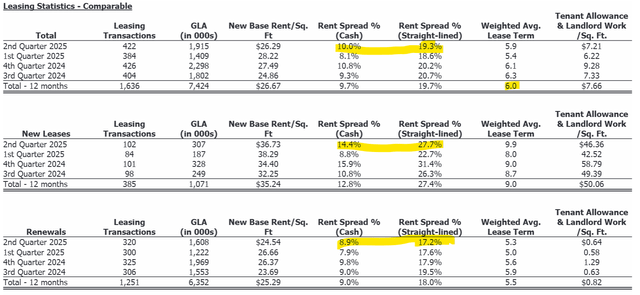
These numbers are very normal for the shopping center sector right now. You would see similar leasing spreads at just about any peer.
We will use GAAP numbers for comparability.
BRX had 19.4% total rent spreads compared to 19.3% for REG. Yet REG had 7.4% same-store NOI growth while BRX came in at only 3.8%.
Brixmor’s same-store NOI looks much closer to the rest of the sector, so there must be something special about the way REG’s leasing is translating to same-store.
Brixmor’s rent spreads consisted of a blend of +43.8% on new leases, 15.5% on renewals and 6.8% on option leases. So while BRX’s new lease rolls are much higher, they are being drowned out by option based renewals granted to tenants from onerous leases signed maybe 10-15 years ago.
Such renewal options have been par for the course in retail’s history. Shopping centers were in bad shape coming out of the Financial Crisis and before they fully recovered the “retail apocalypse” started in which seemingly every retailer wanted to jump into E-commerce. Demand for brick and mortar stores was weak from 2010-2018.
As time went on, retailers realized that a “bricks and clicks” strategy was better as the physical locations actually synergized really well with online. Omnichannel revived retail real estate demand and the environment has been consistently getting stronger since 2018 with exception to brief shutdown during COVID.
Since retail leases tend to be long, it is that 2010-2018 era of leases that is expiring now. In their desperation for tenants, many of the leases signed back then had unfavorable terms like renewal options for tenants where they could extend their leases at very little roll up.
In the 2nd quarter, 756,000 of Brixmor’s leasing activity was via these options. That is close to a 3rd of their overall leasing and the terms of the optioned allowed tenants to stay at just a 6.8% mark-up compared to the 43.8% mark-up for those who had to sign at market rates.
These renewal options are not unique to Brixmor. They are endemic to the sector and dramatically holding back leasing strength from translating into bottom line growth.
Regency is somehow different. As a large and very well capitalized company, REG may have felt less strain in the 2010-2018 era. Its renewal leases were seemingly free of onerous options, allowing their renewals to be as powerfully positive as new leases.
Another significant difference maker as to why REG’s leasing translated to growth is the timing of lease commencement.
SNO Leasing
REG has $38 million in Signed-Not-Occupied (SNO) leases which represents about $0.21 per share in upside as these leases commence.
REG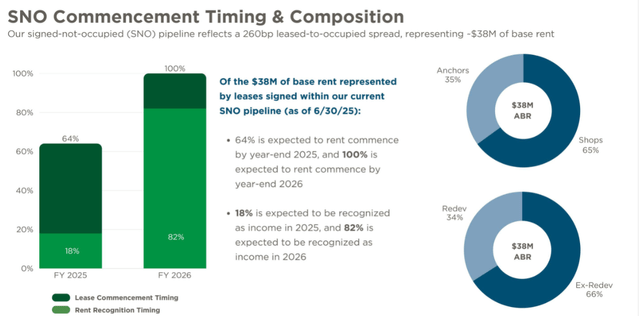
That is a relatively low number compared to peers.
Using Brixmor again as the comparable peer:
BRX has $67.14 million SNO leases or $0.22 per share which represents more than 2X as much as a percentage of overall AFFO.
SNO leasing is not a bad thing. It represents future growth that is contractually baked in. It is however, even better to get that growth today which is what REG is largely doing.
Since REG is sitting at 96%+ occupancy they are approaching full which gives them enhanced negotiating power. It is much easier to tell a tenant that they have to open right away when there are other potential tenants wanting to occupy that exact same space.
Other shopping center REITs are still closer to 93% occupied and at that level they will still gladly accept tenants who might be requesting a 12-16 month opening window.
Summary of leasing differences causing REG to experience faster growth
3 key leasing differences:
- No option renewals
- Less SNO leasing (quicker commencement period)
- Slightly shorter lease terms
In aggregate, these leasing differences cause REG to get its growth NOW while other shopping centers have to wait. Full mark to market will take longer for those with option renewals and achievement of higher NOI will have to wait until SNO leases commence.
In my opinion, this makes Regency’s leasing unequivocally better than the rest of the sector.
However, I think it worth noting that the differences largely come down to timing. When it comes to things that impact long term growth, it is basically the same.
Leasing similarities
- Roll-ups both cash and GAAP
- Mark-to-market magnitude
- Net effective rent as percentage of rent
REG’s net effective rent as a percentage of rent is about 80%
REG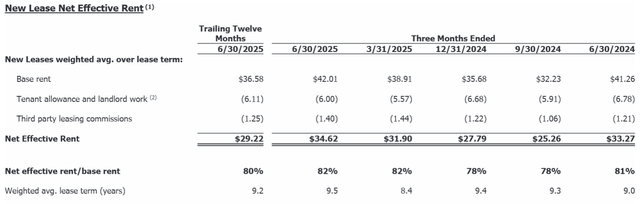
That is very typical of the sector.
With all of this in mind, REG’s healthy strong growth largely stands out because of its accelerated timing.
The majority of shopping centers, particularly those which are grocery anchored are likely to experience the same growth. They just have to wait a little bit longer to realize it.
As such, I see REG’s growth as a look into the future of the shopping center sector. BRX, Kite Realty (KRG), Whitestone REIT (WSR) Kimco (KIM) and others are well positioned to get 8%+ annual growth rates and 7%+ same-store NOI. They simply have to wait for leases to commence and options to bleed off.
REG is a great company and it is trading at a reasonably attractive price. I simply prefer the even cheaper peers whose rapid growth is hiding behind the subtle timing of leasing mechanics.
#Regency #Centers #Glimpse #Future #Shopping #Centers #NASDAQREG