Key Points
-
Several market indicators mirror that of the dot-com bubble of late 1999.
-
When that tech bubble popped, the Nasdaq plunged 78% over three years.
-
Here’s what’s similar about today’s AI-crazed market, what may be different, and what investors should do now.
- 10 stocks we like better than NASDAQ Composite Index ›
Several market indicators mirror that of the dot-com bubble of late 1999.
When that tech bubble popped, the Nasdaq plunged 78% over three years.
Here’s what’s similar about today’s AI-crazed market, what may be different, and what investors should do now.
Investors have ridden an incredible recovery from the April 2 “Liberation Day” tariff surprises. Since the April 8 low, the Nasdaq Composite (NASDAQINDEX: ^IXIC) has appreciated an incredible 40%. And of course, that recovery has taken place amid a decade-long bull market in technology growth stocks.
It’s easy to understand why. Society is becoming more digital and automated. The last 10 years have seen the emergence of cloud computing, streaming video, digital advertising, the pandemic-era boom in electronic devices and work-from-home, all topped off by the introduction of generative artificial intelligence (AI) marked by the unveiling of ChatGPT in late 2022.
Where to invest $1,000 right now? Our analyst team just revealed what they believe are the 10 best stocks to buy right now. Continue »
However, after a long tech bull market, technology growth stocks have reached a worrying valuation level relative to other stocks, and today’s relative overvaluation mirrors an infamous period in stock market history.
Echoes of the dot-com era?
In several ways, technology stock performance and valuations are currently mirroring the extremes of the dot-com boom of the late 1990s. Unfortunately, we all know how that period ended, with a terrible “bust” that sent the Nasdaq tumbling three years in a row, eventually culminating in a 78% drawdown from the March 10, 2000, peak.
QQQ data by YCharts.
How frothy are tech stocks?
Technology innovation can be very exciting; however, that excitement often finds itself in the form of high valuations. According to data published on Charlie Bilello’s State of the Markets blog, the technology sector’s recent outperformance has now exceeded that of the height of the dot-com bubble:
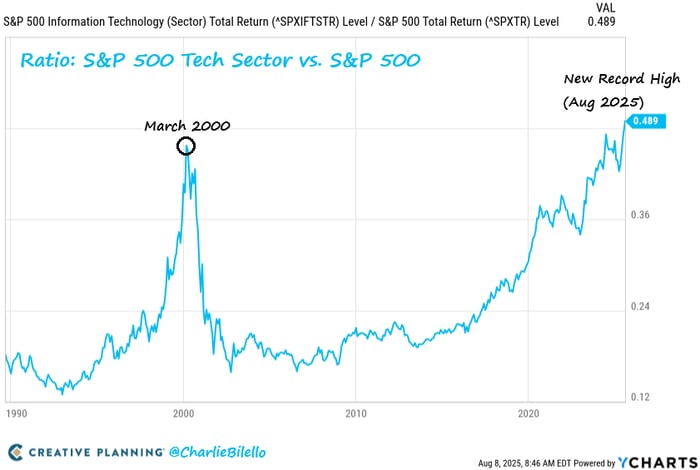
Image source: Charlie Bilello’s State of the Markets blog.
The relative outperformance isn’t the only mirror to the dot-com era. Back then, tech stocks also became very large, leading to an outperformance of large stocks relative to small stocks. Similarly, tech stocks are often growth stocks with high multiples, reflecting enthusiasm over their future prospects. This is in contrast to value stocks, which trade at low multiples, usually due to their more modest growth prospects.
As you can see below, the outperformance of large stocks to small stocks, as well as growth stocks to value stocks, is at highs last seen during the dot-com boom.
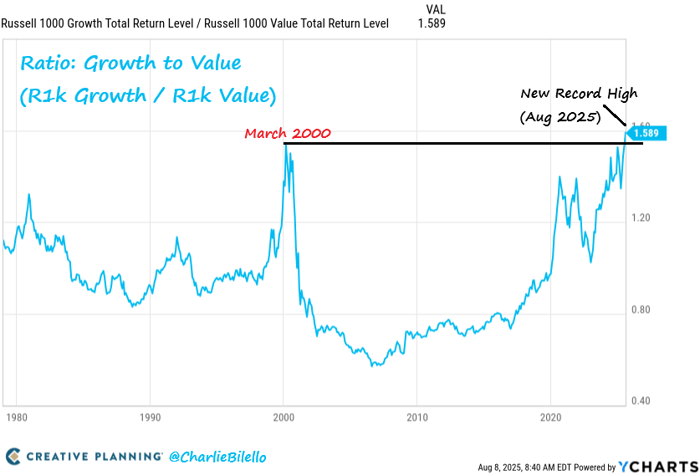
Image source: Charlie Bilello’s State of the Markets blog.
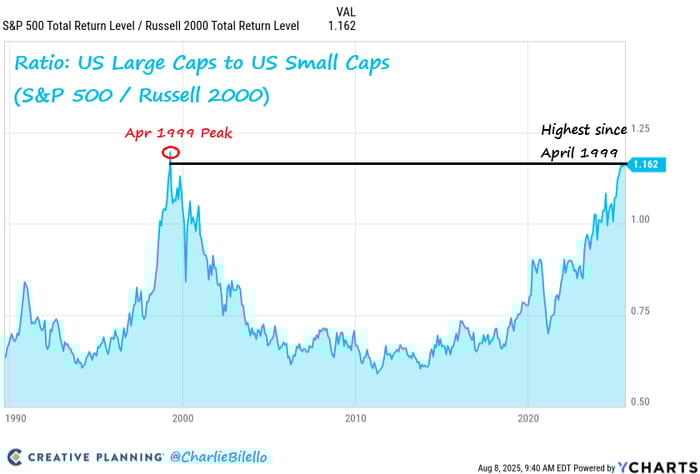
Image source: Charlie Bilello’s State of the Markets blog.
Is it time to worry?
Given that higher-valued tech stocks now make up a larger portion of the index, the Schiller price-to-earnings (P/E) ratio, which adjusts for cyclicality in earnings over 10 years, while not quite at the levels of 1999, has crept up to the highest level since 1999, roughly matching the level from 2021:
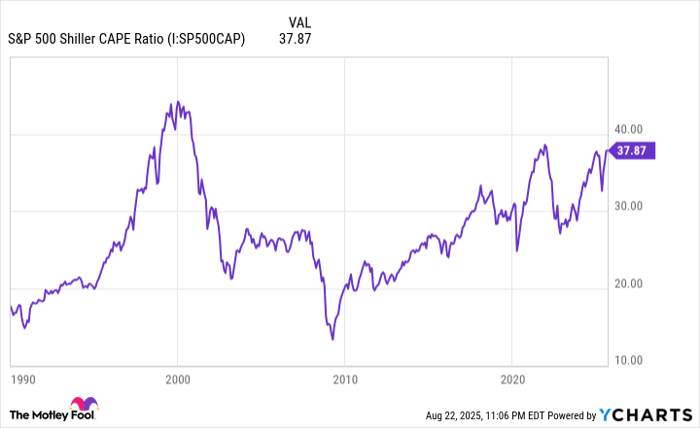
S&P 500 Shiller CAPE Ratio data by YCharts. CAPE Ratio = cyclically adjusted P/E ratio.
As we all know, 2022 was also a terrible year for tech stocks. While it didn’t see a multiyear crash akin to the dot-com bust, 2022 saw the Nasdaq decline 33.1% on the year. Of course, at the end of 2022, ChatGPT came out, somewhat saving the tech sector as the AI revolution kicked off.
Counterpoints to the bubble thesis
Thus, when compared to history, tech stocks are at worrying levels. Given the similarities to the 1999 dot-com bubble and the 2021 pandemic bubble, some may think it’s time to panic and sell; however, there are also a few counter-narratives to consider.
The first is that, unlike in 1999, today’s technology giants are mostly truly diversified, cash-rich behemoths that account for a greater and greater percentage of today’s gross domestic product (GDP). While the late 1990s certainly had its leaders — including Microsoft (NASDAQ: MSFT), the only market leader that is in the same position today as then — they weren’t really anything like today’s tech giants, with robust cloud businesses, global scale, diversified income streams, and tremendous amounts of cash.
While market concentration in the top three weightings tends to occur before market downturns, index weighting concentration appears to be somewhat of a long-term trend now, increasing beyond prior highs in 1999 and 2008 since 2019.
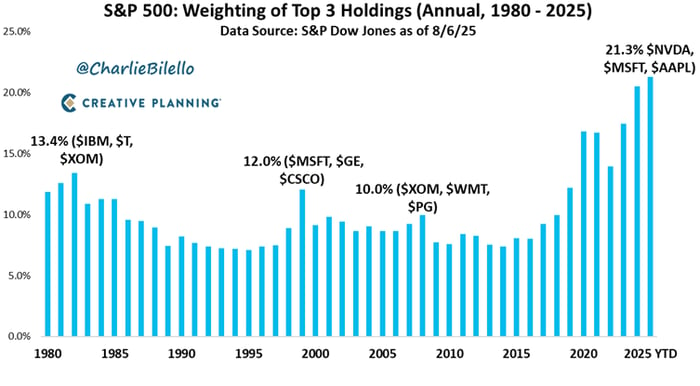
Image source: Charlie Bilello State of the Markets blog.
Thus, it seems a higher weighting of the “Magnificent Seven” stocks could be a feature of today’s economy, rather than an aberration.
While it’s true that some of today’s large companies are overvalued, given their underlying strength and resilience, it’s perhaps not abnormal for them to garner higher-than-normal valuation multiples.
What investors should do now
It’s important to know that while taking note of market levels is important, it is extremely difficult to time market downturns. Famed investor Peter Lynch once said, “Far more money has been lost by investors preparing for corrections, or trying to anticipate corrections, than has been lost in corrections themselves.”
So, one shouldn’t abandon one’s long-term investing plan just because overall market levels may be frothy. That being said, if you need a certain amount of cash in the next one to two years, it may be a good idea to keep that money in cash or Treasury bills until then, rather than the stock market.
Furthermore, if you have a regular, methodical investing plan, stick to it. But if you are consistently adding to your portfolio every month or quarter, you may want to look at small caps, non-tech sectors, and value stocks today, rather than adding to large technology companies.
Should you invest $1,000 in NASDAQ Composite Index right now?
Before you buy stock in NASDAQ Composite Index, consider this:
The Motley Fool Stock Advisor analyst team just identified what they believe are the 10 best stocks for investors to buy now… and NASDAQ Composite Index wasn’t one of them. The 10 stocks that made the cut could produce monster returns in the coming years.
Consider when Netflix made this list on December 17, 2004… if you invested $1,000 at the time of our recommendation, you’d have $649,657!* Or when Nvidia made this list on April 15, 2005… if you invested $1,000 at the time of our recommendation, you’d have $1,090,993!*
Now, it’s worth noting Stock Advisor’s total average return is 1,057% — a market-crushing outperformance compared to 185% for the S&P 500. Don’t miss out on the latest top 10 list, available when you join Stock Advisor.
See the 10 stocks »
*Stock Advisor returns as of August 18, 2025
Billy Duberstein has positions in Microsoft. The Motley Fool has positions in and recommends Microsoft. The Motley Fool recommends the following options: long January 2026 $395 calls on Microsoft and short January 2026 $405 calls on Microsoft. The Motley Fool has a disclosure policy.
The views and opinions expressed herein are the views and opinions of the author and do not necessarily reflect those of Nasdaq, Inc.
#Nasdaq #Reached #Terrifying #Valuation #Level #History #Clear