
Naomi Fink
Possibly the only figure more fiscally frightening than the recent U.S. debt-to-GDP ratio is its inverse: In 2024, for each dollar of outstanding U.S. national debt, the U.S. produced only 82 cents worth of economic activity. That said, the U.S. has faced periods of costly output before, and its typical solution is to grow (and inflate) its way to less-worrisome fiscal levels.
In 2021 and 2022, the U.S. appeared well on its way to doing exactly that. Coming out of the COVID-19 pandemic, as economic activity recovered, the ratio of government debt to tax revenues decreased, only to stall in 2023, then expand once again in 2024. How can this be? In most recent years, the U.S. has been growing by 2% to 3%, an admirable expansion pace for a developed economy. According to many public sources, some of them official, U.S. labor productivity is also contributing markedly to growth without inviting inflation. Isn’t it?
US GDP Per $ Total Public Debt (SA)
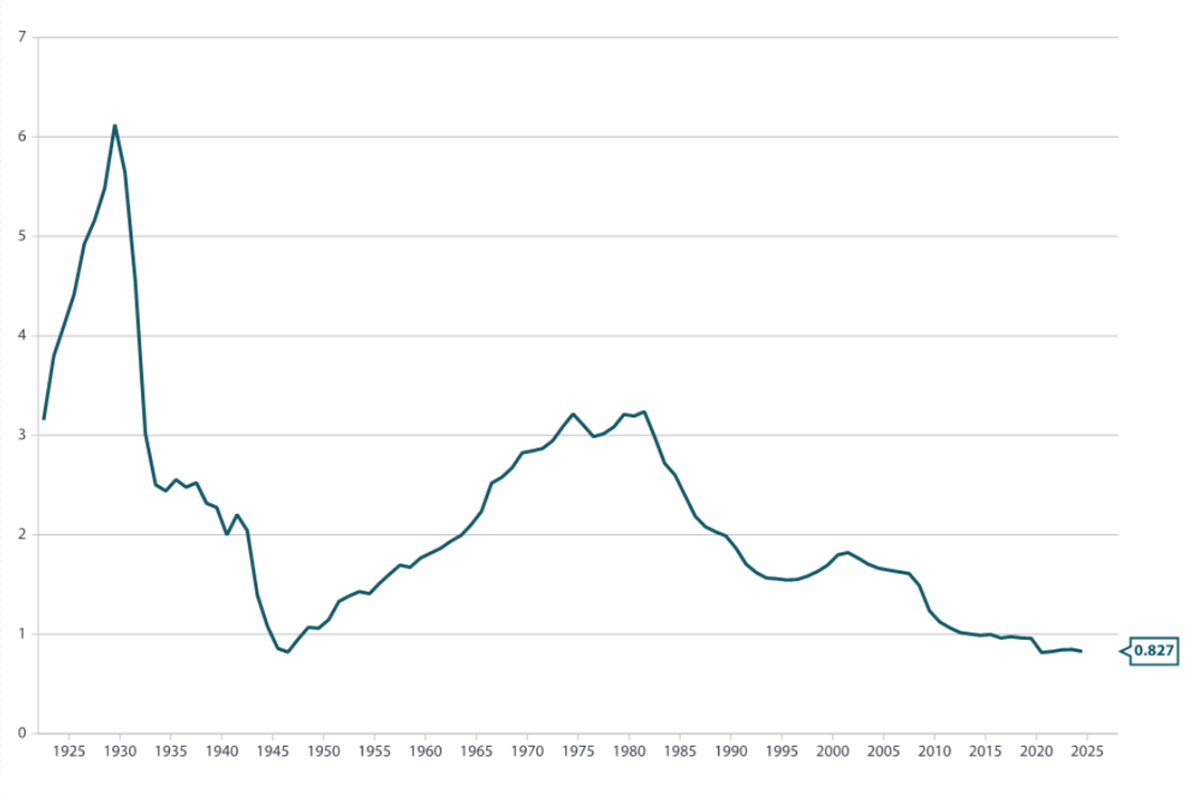
Source: Nikko Asset Management, World Bank, St. Louis Fed
Innovation and Total-Factor Productivity Drive Long-Term Growth
One of the problems with using labor productivity (otherwise known as per-capita GDP), however, is that it does not distinguish between growth driven by innovation and lots of money being spent to replace wages with depreciation costs, which is what happens when physical capital is accumulated to replace labor in the absence of innovation. That’s not only scientific innovation, but also business innovation that increases consumer surpluses by improving their standards of living without necessitating an increase in total work hours. This type of productivity is also measurable (to some extent). We refer to total-factor productivity—not just GDP per capita—the residual of output, after accounting for both labor and capital inputs.
For more stories like this, sign up for the CIO Alert newsletter. ?
Total Factor Productivity, Constant Prices, USD
United States [m.a. 10 years, a.r. 1 year]
Japan [m.a. 10 years, a.r. 1 year]
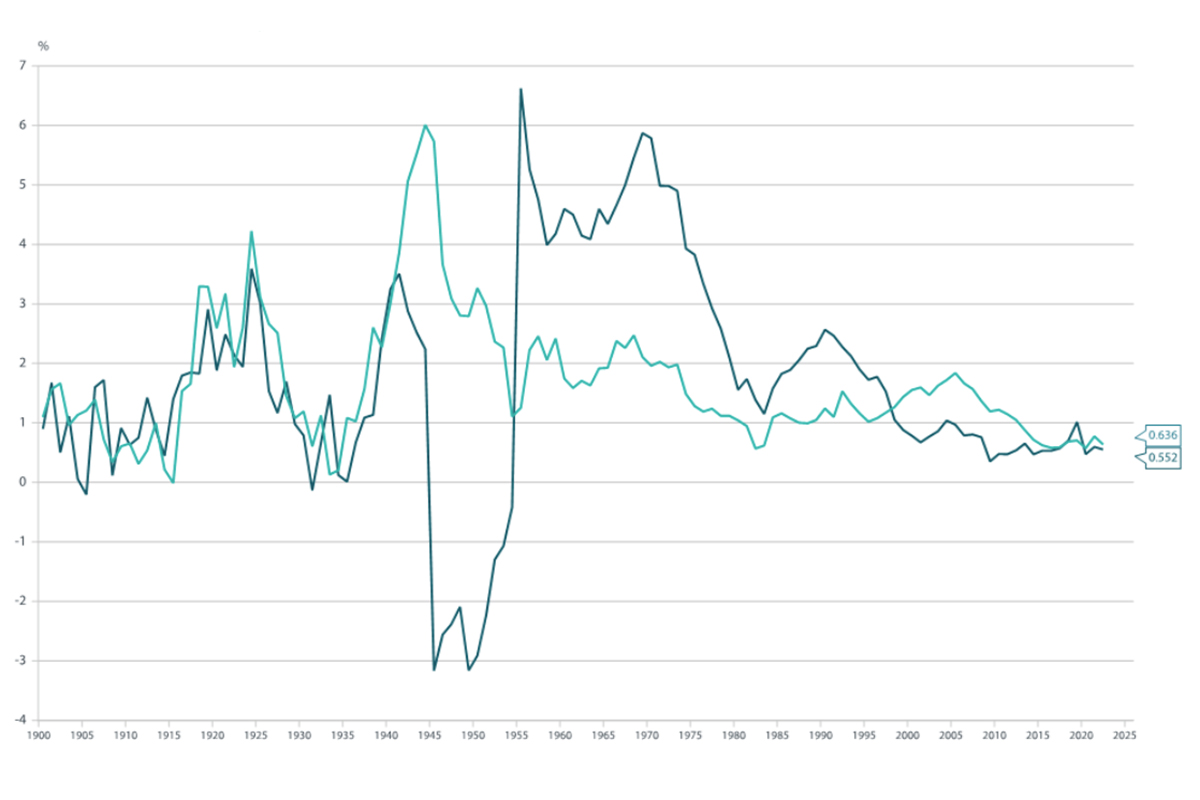
Source: Nikko Asset Management, Long-Term Productivity Database
By this measure, U.S. total-factor productivity growth is positive, but remains much less impressive than per-capita GDP growth. In fact, over the last 10 years, U.S. TFP has grown at a sub-1% rate that is more akin to Japan’s productivity-growth rate than to the TFP of the U.S. (nearly 2% at one point) in the early 2000s, between the tech bubble and the global financial crisis.
The large amount of physical capital expenditure by public and private sectors, which has exceeded increases in expenditure on human capital, is largely responsible for the discrepancy. It therefore boosts output in a more expensive way, namely by making physical and intangible capital investments, than by growing total-factor productivity.
But it is important to note that the two—labor productivity and TFP (the innovative type of productivity)—are related. It is a robust finding in economics that long-term growth in labor productivity (per capita GDP) must be driven by TFP to be sustained over time. This type of growth, in turn, is a much more palatable way to reduce debt balances than by simply cutting nominal government expenditure or raising taxes.
Not to Fear, Innovation is … Coming
The relationship between innovation and production casts a not altogether pessimistic light on our first figure (GDP per dollar of outstanding debt). Large investments do typically precede large improvements in productivity. As we saw in the late 1990s and early 2000s in the U.S., peak TFP growth was achieved with a lag to the heady investment era of the tech bubble in the late and contributed to a time of low-inflation growth prior to the global financial crisis, at which time TFP growth started to decelerate.
Many recent academic studies of TFP have cited the “J-curve” effect, characterizing the relationship between investment booms and TFP growth as one in which large costs are incurred to adopt new technologies (such as digital technologies), but wherein it takes time for economic growth great enough to offset the initial costs of investment to occur. In the gap between the initial outlays of investment in innovation and the realization of TFP, there is a period during which the costs outweigh the immediate returns of digitalization.
Getting From Narrow Innovation to TFP: Invest in Human Capital
As we highlighted above, the road to TFP is not simply paved with replacing labor expenditure with physical and intangible capital, which will depreciate over time. Indeed, a key characteristic of the current digital investment boom has been the cultivation of human capital, which involves training and incentivizing part of the labor force to continue contributing to rapid innovation.
It is possible that some firms participating in the digital economy already have transformed innovation into higher firm-level productivity, which may be reflected in the rapid pace of earnings growth and, thus, lofty valuations of large-cap technology stocks in the U.S. The problem is that the technology sector is unlikely to single-handedly pay off the U.S. national debt. The gains from technology at an aggregate economy level are likely to come from broadening the impact of the labor-enhancing technology outside of the technology sector. There is no reason to believe that such broadening, within the U.S. economy and even abroad, (note Japan’s rapidly growing digital deficit with the U.S.) will not eventually bear fruit.
Who Are the Beneficiaries of the TFP Boom to Come?
With the duo of ever-declining combined tax and interest costs possibly nearing an end (per the Federal Reserve Board’s principal economist, Michael Smolyansky), the beneficiaries are companies that innovate by investing and allocating capital to enhancing the productivity of their core competencies, distinguishing themselves from competitors within and outside their sectors. It is possible that, as an era of more volatile stock prices unfurls, so do new opportunities for active investment in the next generation of companies most motivated, not only to invest in new, innovative physical and human capital, but to allocate their combined capital and labor in profitable new ways.
Unlikely but Positive Role Model: Japan
As a blueprint of how to harness a productivity revival to replenish fiscal coffers, Japan’s recent fiscal developments offer a surprisingly positive example. Although Japan’s net debt-to-GDP exceeds that of the U.S., its fiscal direction has been more positive. Following the pandemic, Japan has been making effective use of newly reflationary conditions to collect tax revenues at a faster pace than the growth of its government debt, which is the way a country goes about inflating away large debt balances.
Despite faster GDP growth over the same period, the U.S. has abandoned this measure of fiscal discipline (growing debt faster than tax receipts since 2023). Just as Japan is nearing its goal of primary balance surplus, the U.S. has dipped into primary balance deficit. But now that costly investments have already been made in U.S. technology, it is possible that an eventual productivity boost is forthcoming, which, in turn, may contribute to broad-based corporate profits of the taxable variety. This is the necessary step that may help the U.S. regain primary surpluses and inflate away debt once again.
Naomi Fink is the chief global strategist at Nikko Asset Management.
This feature is to provide general information only, does not constitute legal or tax advice, and cannot be used or substituted for legal or tax advice. Any opinions of the author do not necessarily reflect the stance of ISS STOXX or its affiliates.
Tags: economic recovery, national debt, productivity
#Borrowing #Future #Means #Reliance #Growth #Inflation