In the second quarter of 2025, home price growth cooled across U.S. metro areas, reflecting shifting market dynamics amid persistent affordability challenges and rising mortgage costs.
According to the National Association of Realtors latest report on Metropolitan Median Area Prices and Affordability, 75 percent of the 228 metro markets recorded home price gains, down from 83 percent in the first quarter. Double-digit price increases also slowed sharply, with only 5 percent of metros posting such gains compared to 11 percent earlier this year.
The national median price for existing single-family homes edged up 1.7 percent year-over-year to a record $429,400, a slower pace than the 3.4 percent increase seen in the first quarter. Regional variations stood out: the Northeast led with a 6.1 percent gain to $527,200, driven largely by constrained inventory, while the Midwest followed with a 3.5 percent rise to $328,800, buoyed by stronger affordability. In contrast, the West saw a modest 0.6 percent increase to $646,100, and the South, particularly states like Florida and Texas, experienced essentially flat prices as new construction alleviated some pressure on supply.
Lawrence Yun
NAR Chief Economist Lawrence Yun emphasized that divergent regional trends reflect the underlying market forces at play. “Home prices have been rising faster in the Midwest due to affordability and in the Northeast because of limited inventory,” Yun said. “Meanwhile, the South is undergoing a price correction as recent years’ new homebuilding eases supply constraints.”
Despite robust job creation–over 7 million net additions since the pre-pandemic peak–housing sales and homeownership rates lag. Elevated mortgage rates have suppressed buyer activity, leaving sales below pre-COVID levels and pushing the homeownership rate down by a full percentage point since early 2023. Yun noted that should interest rates ease, demand is poised to surge in fast-growing states such as Idaho, Utah, the Carolinas, Florida, and Texas.
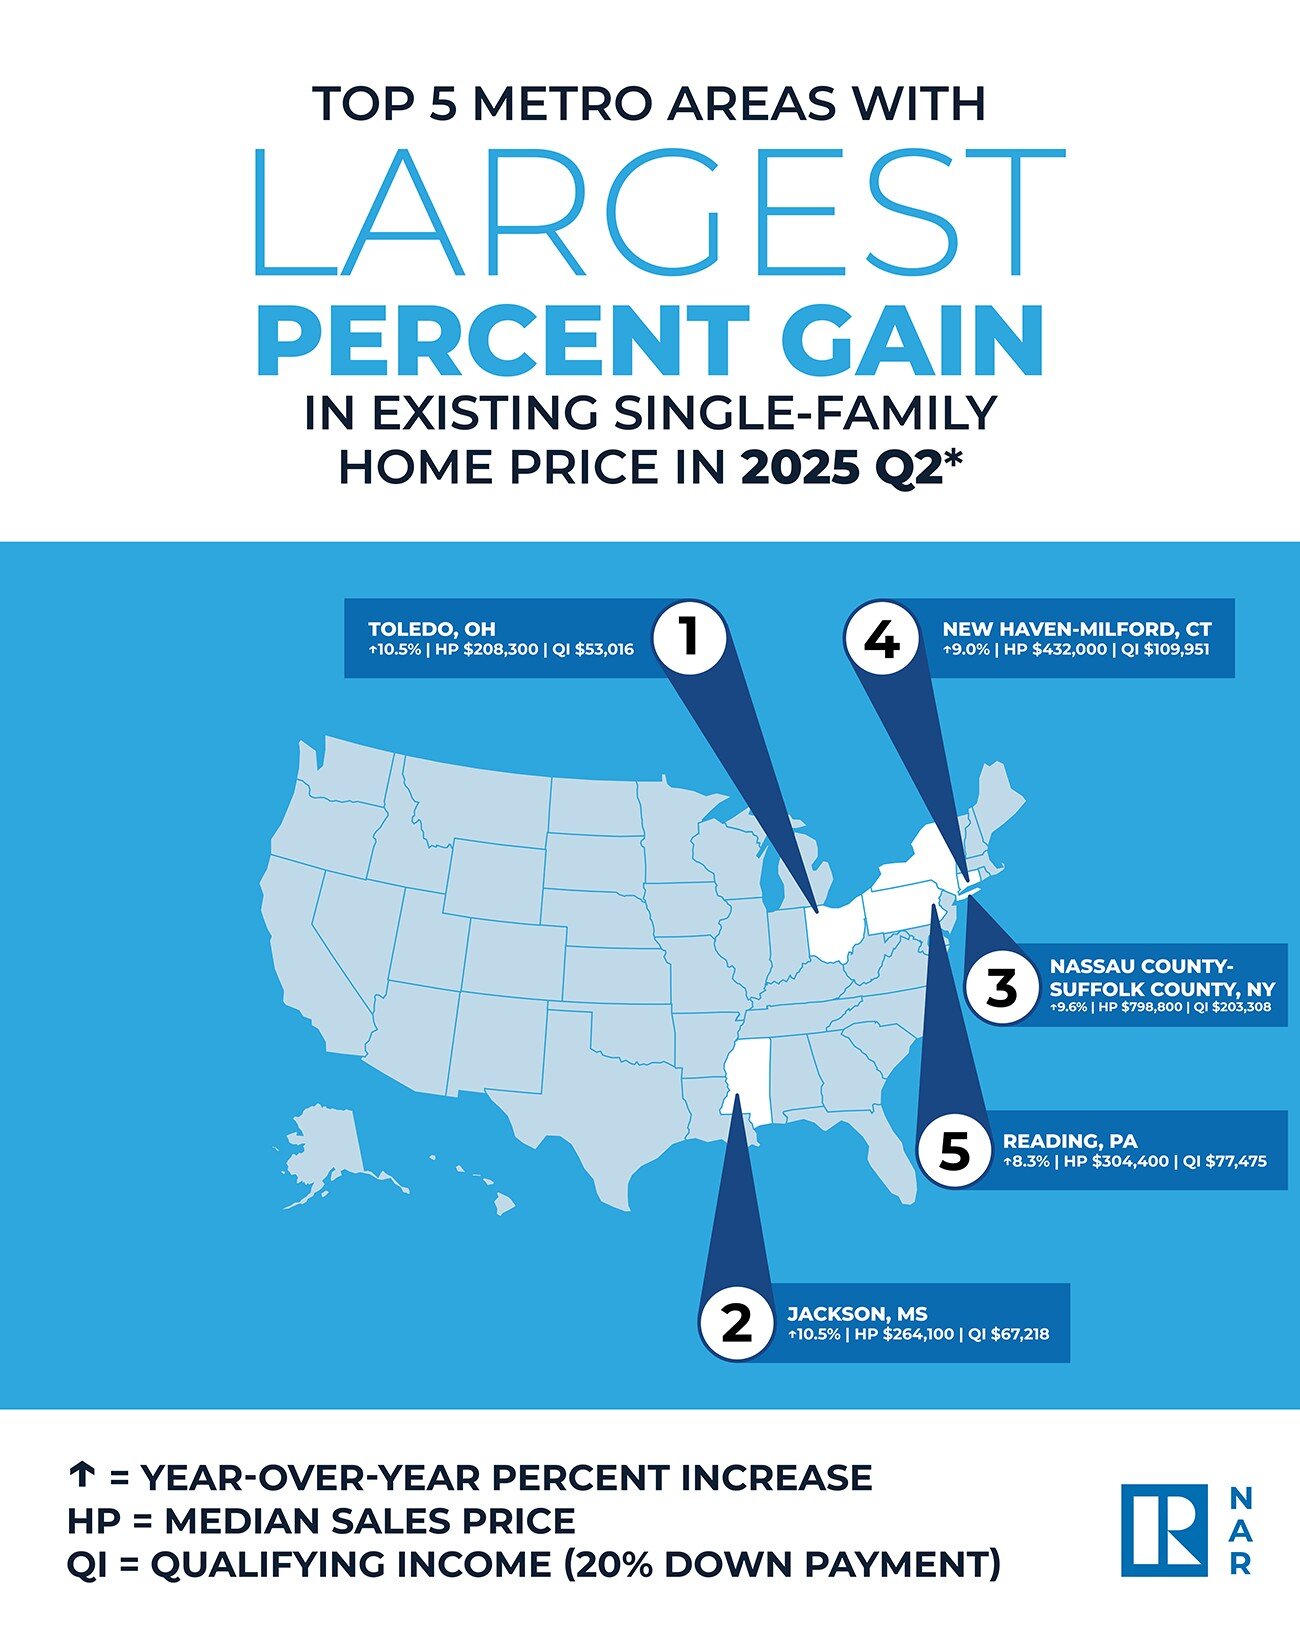
Among individual metro areas, Toledo, Ohio, and Jackson, Mississippi, led with the largest annual median price increases at 10.5 percent each. Other notable markets with strong gains included Nassau-Suffolk in New York and New Haven-Milford, Connecticut, both nearing 9 to 10 percent growth. Meanwhile, California dominated the list of priciest housing markets, with San Jose-Sunnyvale-Santa Clara topping $2.1 million despite a more modest 6.5 percent price rise. However, several expensive California metros, including San Francisco and San Diego, saw slight price declines amid affordability pressures.
Affordability remains a key concern as nearly a quarter of markets posted falling home prices this quarter, up from 17 percent in the prior period. The typical monthly mortgage payment for an existing home with a 20 percent down payment rose 6.5 percent quarter-over-quarter to $2,256, though it was down slightly year-over-year. On average, families allocated about 25.7 percent of their income toward mortgage costs–higher than last quarter but below the share recorded a year ago.
First-time buyers faced rising monthly payments on starter homes, averaging $2,212 in the second quarter, an increase of $134 from the first quarter. The share of income devoted to these payments also ticked up to 38.7 percent, highlighting ongoing affordability challenges for entry-level buyers despite a modest year-over-year decline.
As mortgage rates remain elevated and inventory dynamics evolve, the U.S. housing market continues to navigate a complex landscape where regional disparities, economic fundamentals, and financing costs shape the outlook for buyers and sellers alike.
Real Estate Listings Showcase
#U.S #Home #Price #Growth #Slows #Affordability #Pressures #Mount